One of the most common failure points in AI visibility work has almost nothing to do with the quality of your measurement. It’s a translation failure. You’re speaking in metrics Citation Rate, Share of Voice, Sentiment and leadership is listening for something else entirely: share, competitors, and revenue. Until your report speaks that language, it doesn’t matter how clean your data is. It won’t move a decision.
The scale of the gap:
- AI search traffic converts at roughly 5x the rate of traditional Google organic traffic
- Yet only about 1 in 5 marketers currently track their brand’s AI visibility at all
This piece closes that gap not with more charts, but by rebuilding the report around the three questions leadership actually asks: Are we gaining or losing ground? Against whom? What does it cost us if we don’t act?
Why Good Data Still Fails to Move Leadership
The disconnect:
- Practitioners think in measurement – you know Citation Rate from Share of Voice instinctively, you can spot a meaningful three-point sentiment shift versus noise
- That fluency is invisible to the reader – leadership doesn’t share your mental model, and won’t build it from a slide of numbers
- Leadership does have a mental model for: competitive position and business risk “are we winning or losing,” “against which competitor,” “what’s that worth”
The fix: Your job isn’t to teach leadership AI visibility metrics it’s to translate your metrics into the categories they already use to decide things. A report that requires the reader to learn a new framework before acting is a report that gets set aside “for later.” That time rarely comes.
Turn Your Metrics Into a Story, Not a Spreadsheet
Citation Rate, Share of Voice, Sentiment, and your gap analysis aren’t the report they’re the evidence inside the report. Connecting the dots is the value you add, and it has to happen on the page, not in the reader’s head.
Fixed narrative order, every time:
- What happened
- Why it happened
- How it stacks up against competitors
- What to do next
This mirrors how people naturally process a business update: headline first, explanation second, competitive context third, decision last. Skipping a step or reordering it is usually what makes a report feel like “just data” instead of “an update I can act on.”
1. Lead with the headline, not the dashboard
Before a single chart appears, state the one sentence that matters most this period not a summary of everything tracked, the single most consequential development.
“Share of Voice climbed 12% on commercial prompts, but Competitor X now leads every product-comparison query a category worth an estimated $2M in influenced pipeline this quarter.”
Why this works:
- It states a number, but doesn’t stop there
- It attaches a competitor and a dollar figure
- A metric describes what happened to your data; a headline describes what happened to your business, using your data as proof
- If you can’t attach a dollar figure or clear competitive stake to a finding yet, it’s not ready to lead it belongs further down
Why this matters at scale: more than half of B2B software buyers now start research in an AI chatbot instead of a search engine, and most say AI recommendations sped up their decision . A headline like the one above describes a shift in where the buying journey starts not a marginal SEO metric.
2. Connect every metric to a business consequence
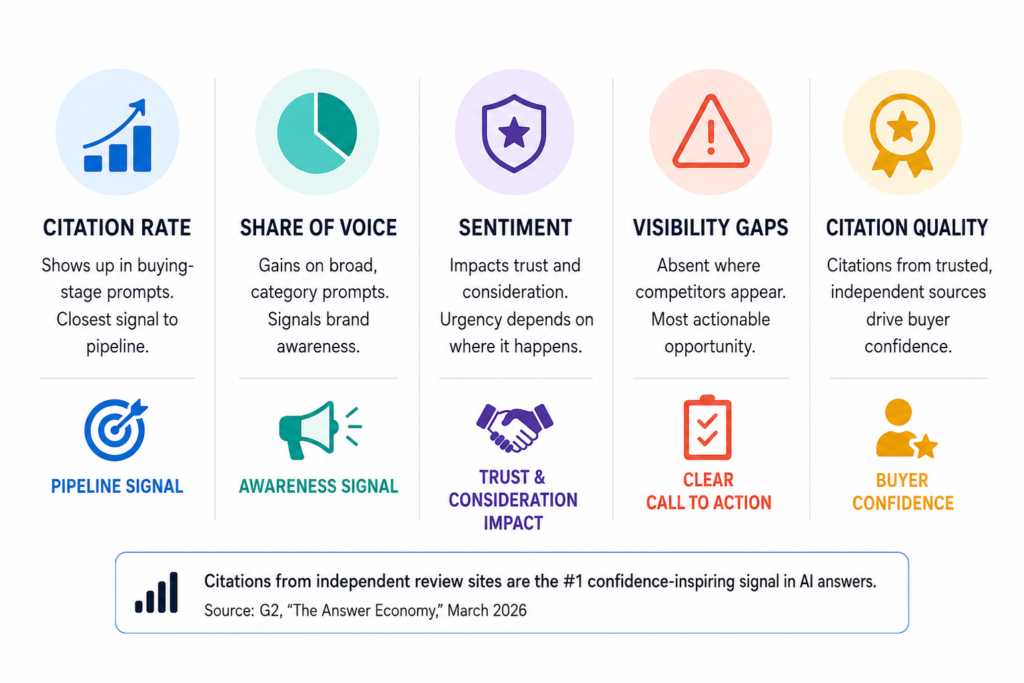
Most reports lose the room here: they report the movement up 10%, down 6% without saying what it’s worth. A number without a consequence is trivia, and executives don’t act on trivia.
| Metric | What It Signals | How to Frame It |
|---|---|---|
| Citation Rate (Commercial, High-Intent Prompts) |
You’re showing up during the buying journey. | The closest thing AI visibility has to a pipeline signal. State this clearly, while avoiding claims of direct revenue attribution. |
| Share of Voice (Broad, Category-Level Prompts) |
Brand awareness. | A step removed from revenue. Report it as an awareness metric so it is neither over- nor under-weighted. |
| Sentiment Shifts | Trust and consideration. | Urgency depends on context. A negative shift for “Is [Brand] reliable for enterprise use?” is far more important than a neutral mention in an informational query. Report sentiment where it matters, not as a single average. |
| Visibility Gaps | The clearest call to action in the report. | Specific and actionable. When competitors appear but your brand does not, prioritize these findings because they represent clear optimization opportunities. |
Why citation type matters, not just count: nearly half of buyers name citations from independent review sites as the single most confidence-inspiring signal in an AI-generated answer more than any other source type measured (G2, “The Answer Economy,” March 2026). That’s a direct reason Citation Rate deserves its own line rather than folding into a general “visibility” number.
3. Make the competitive comparison the spine of the report
AI models routinely surface multiple brands in a single answer your numbers only mean something next to a competitor’s.
- “Are we improving?” is the easy half of the question
- “Are we improving relative to who we’re actually competing with?” is the half that determines whether this gets budget
Go further than ranking explain the mechanism:
- Did a competitor ship content into a gap you’d left open?
- Did they run a campaign that temporarily spiked their presence?
- Did your visibility slip because of something on your side an underperforming refresh, lost structured data, a deprioritized category?
These are three different stories with three different next steps. “We lost ground” is not actionable. “We lost ground because Competitor X published a comparison guide targeting the exact prompt category we’ve been ignoring” is immediately actionable.
Why this reframes the whole exercise: in the largest buyer-behavior study of 2026 (18,000+ global business buyers), AI research tools now outrank vendor websites, product experts, and direct sales contact as a meaningful source in the purchase decision. Forrester’s own conclusion: vendors need to shift from optimizing for search engines to optimizing for visibility inside AI-generated answers (Forrester Buyers’ Journey Survey, January 2026). You’re no longer just benchmarking against competitor content you’re benchmarking against who the system doing the buyer’s research actually selects.
4. Close on a decision, not a data point
- End with the two or three highest-leverage moves for the next cycle: close a specific competitive gap, fix a sentiment issue on a high-intent prompt, or double down on a category you’re already winning
- Every recommendation should trace back to a specific finding earlier in the report nothing should arrive from nowhere
A report ending in “here’s what happened” gets filed away, however well written. A report ending in “here’s what we should do, here’s why, and here’s roughly what it’s worth” gets a decision — because you’ve done the last mile of work for the reader instead of leaving it for their own time (which, in practice, means it doesn’t get done).
What to Show, and What to Leave Out
The instinct with good data is to include all of it you tracked it, it took effort. Resist that instinct. The value you add isn’t the volume of data collected; it’s the judgment applied in deciding what’s worth a leader’s attention.
Include in the leadership-facing report
- The headline takeaway for the period, in one sentence, stated as a business fact rather than a metric movement
- The core scorecard Citation Rate, Share of Voice, Citation Position, and Sentiment each shown against the prior period so direction is obvious at a glance
- Competitor movement: who gained visibility, who lost it, in which specific prompt categories
- The two or three visibility gaps with the clearest, most defensible business case for action not every gap found
- A short, explicit sentence linking each major finding to a business outcome (awareness, pipeline, consideration, or risk)
- Two to three prioritized recommendations for the next cycle, each traceable to a specific finding above it
Leave out, or move to an appendix
- Individual prompts and raw AI responses – essential for your own QA and defending a finding, but they slow the reader down without adding decision-making value
- Every metric you happen to track – if a number doesn’t change the headline, the competitive story, or the recommendation, it’s noise in this context
- Metrics presented without a stated “why” – an unexplained swing invites the exact clarifying question that can derail a meeting; answer it proactively in one sentence
- Conclusions drawn from a single data pull -this one is a credibility issue, not just a formatting one (see below)
The Honesty Rule:
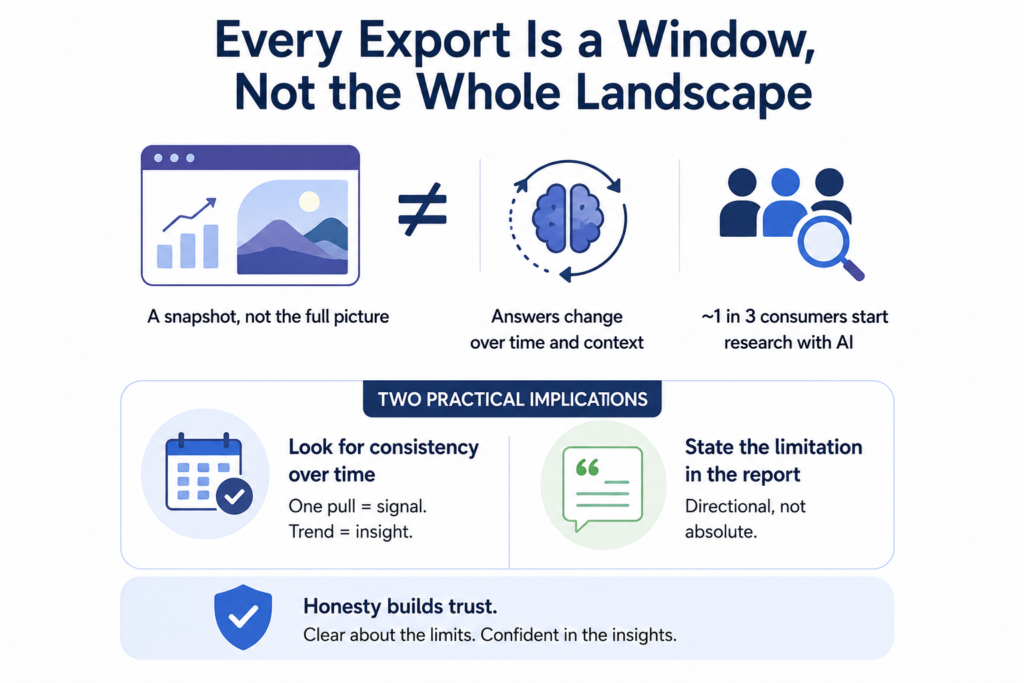
Landscape
This caveat has to travel with every version of the report it protects the credibility of everything else in the document.
- AI-generated answers aren’t static text sitting on a server waiting to be measured
- The same prompt can return a meaningfully different answer depending on timing, user context, geography, or an overnight model update
- A single export is a sample of AI behavior captured in that window not a permanent measurement of how a model treats your brand
Why this matters more than it might seem: roughly a third of consumers now use AI tools at the very first, discovery stage of research well over double the share using traditional search at that same stage (Similarweb, 2026 AI Brand Visibility Report). When that much of the earliest, most exploratory part of the funnel runs inside a system that answers differently depending on timing and context, anchoring a business decision to one frame of a moving picture is a real risk.
Two practical implications:
- Don’t build a headline finding off a single data pull. A genuine trend holds up across a consistent prompt set measured over multiple periods consistency over time, not the size of any one number, is what makes a finding solid enough to justify a recommendation. A single data point can appear as an early signal to watch, but it shouldn’t anchor your headline or budget ask.
- State the limitation explicitly, in the report itself. A line as simple as:
“These findings reflect a defined prompt set measured over [period]; AI responses vary by timing and context, so figures should be read as directional rather than absolute.”
costs almost nothing in confidence and buys real credibility. It pre-empts the “is this number exact?” question, and signals that you understand the tool better than a dashboard export alone would suggest. Executives trust practitioners who are upfront about the edges of their data far more than ones who present every number as gospel.
Reporting Cadence: Match the Rhythm to the Audience
Reporting more often than an audience needs doesn’t demonstrate diligence it adds noise that trains people to skim.
| Cadence | Best For | Why |
|---|---|---|
| Weekly | Your team and marketing/SEO collaborators. | Best for operational monitoring. Teams actively managing content can spot competitor movements quickly and respond before trends become established. |
| Monthly | Executives and business stakeholders. | Frequent enough to identify meaningful changes before they become larger gaps, while reducing the reporting noise that often disappears on its own. This is the recommended reporting cadence for executive AI visibility dashboards. |
| Quarterly | Senior leadership and strategy reviews. | Ideal for long-term benchmarking, measuring the impact of strategic initiatives, and evaluating whether AI visibility investments are delivering business value compared with other priorities. |
Why monthly is the right default for executives: roughly half of consumers across every age group including older demographics not typically associated with early tech adoption now intentionally use AI-powered search specifically for purchasing decisions (McKinsey, October 2025 Consumer Survey). A trend that broad and consistent is exactly what a monthly cadence is built to catch early; quarterly reporting alone means leadership finds out after competitors have already moved on it.
Whichever cadence applies: keep the format identical from one report to the next. Stakeholders spend their limited attention on what’s different this period instead of relearning how to read the document which, over a year of reporting, adds up to real goodwill you’d otherwise burn on formatting.
A Reusable Report Outline
Use this as a working template for every cycle, regardless of cadence:
- Headline -one sentence, the single most important development this period, tied to a competitor or a number leadership cares about not a metric movement on its own
- Scorecard – Citation Rate, Share of Voice, Citation Position, and Sentiment, each shown against the prior period so trend direction is immediate
- Competitive movement – who gained or lost visibility, in which prompt categories specifically, and the likely mechanism where identifiable
- Visibility gaps -the two or three highest-value prompts or categories where you’re absent and a named competitor isn’t
- Business impact – a short, explicit line connecting each major finding above to awareness, pipeline, consideration, or risk
- Recommendations – two to three prioritized actions for the next cycle, each tied directly to a specific finding earlier in the report
- Methodology note -the prompt set used, the time window covered, and a brief reminder that this is a representative sample, not a complete or permanent picture of AI behavior
Everything else the full prompt list, raw AI outputs, competitor-by-competitor granular detail — lives in an appendix or a separate working document your team references, not in front of leadership. Keeping that material available but out of the primary report lets you defend any finding if questioned, without slowing down the read for the person who just needs to make a call.
FAQ
1. How do I get leadership to actually act on an AI visibility report, not just read it?
End every report with a small number of prioritized, specific recommendations, each tied directly to a stated business impact not a list of findings left for the reader to interpret. A report that ends in a decision gets acted on; one that ends in an observation gets filed and forgotten.
2. How often should I report AI visibility to executives?
Monthly is the standard cadence for leadership frequent enough to catch real trends, spaced out enough to avoid reporting noise that would reverse itself. Weekly suits your own operational team; quarterly suits strategic, budget-level reviews.
3. What’s the difference between Share of Voice and Citation Rate, and which matters more to executives?
Share of Voice measures your presence relative to competitors across a set of prompts useful for framing brand awareness. Citation Rate measures how often you’re cited specifically, and on commercial or high-intent prompts, it’s the closer proxy for buying-journey visibility. Lead with whichever ties more directly to the business outcome you’re arguing for.
4. Why shouldn’t I build a headline finding off a single data export?
Because AI-generated answers vary by timing, user context, and model updates, a single export is a sample, not a definitive measurement. A finding only becomes reliable enough to anchor a recommendation once it holds up across a consistent prompt set measured over multiple reporting periods.
5. What belongs in an appendix instead of the main report?
Raw AI responses, the full list of tracked prompts, and granular competitor-by-competitor breakdowns. Keep these accessible for follow-up questions, but out of the primary document they slow down the read without adding to the decision the reader needs to make.
Want to know where your brand stands in the citation economy?
We run a free 6-platform AI visibility audit during a 30-minute strategy call. No prep required — we'll scan your category live during the conversation.