Citation Rate measures how often an AI platform visibly attributes an answer to your website or content, across a defined set of tracked prompts. It does not measure how often your content is used internally by the model while it composes an answer, how often your brand name gets said out loud, or how you stack up against named competitors. Those are three separate metrics, and as you’ll see below they can move in completely different directions from one another over the same reporting period.
Four Metrics, Four Different Questions
Retrieval Rate is the metric everyone assumes they’re measuring and almost nobody actually is. It refers to whether your content was pulled into the model’s context window at all while it generated a response a step that happens before any citation decision and that most AI platforms simply don’t expose.
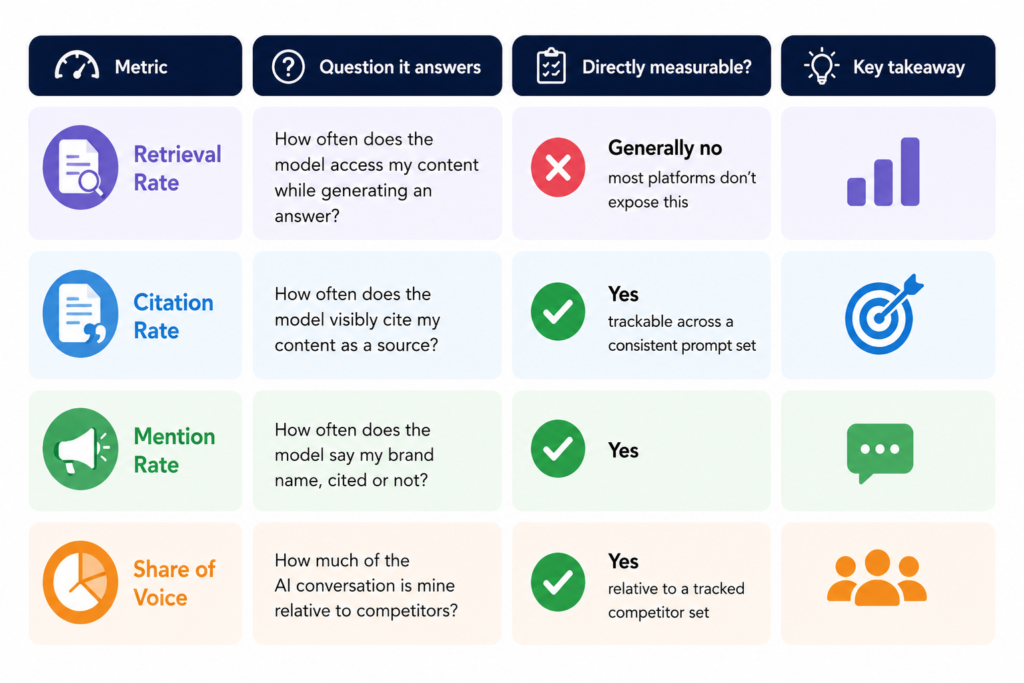
Citation Rate, by contrast, is fully observable: either a citation link or attribution appears in the response or it doesn’t. This is the metric this guide focuses on, precisely because it’s the one you can actually track with confidence.
Mention Rate is a different question again it only cares whether your brand name shows up in the text, regardless of whether a link or source citation accompanies it. A model can recommend your company by name while citing a competitor’s blog post or a third-party review site as its source.
This isn’t a hypothetical edge case: a 2026 analysis of ChatGPT’s sourcing behavior found the platform frequently discusses brands by name while rarely linking to them directly, a pattern researchers describe as awareness without a click ChatGPT will talk about your brand, it just won’t always send users to you.
Share of Voice zooms out further still, comparing your Mention Rate against a defined set of competitors, so it can shift even without any change in your own performance a competitor losing visibility raises your relative share without you doing anything differently.
These aren’t just definitionally distinct they behave independently in practice, which is the real reason they need to be reported separately rather than folded into one blended “AI visibility score”:
- A site can have a high Citation Rate but low Mention Rate. This is common for research-heavy publishers: the model treats their data or reports as a trusted source and links to them, without ever naming the company behind the research in the surrounding prose.
- A brand can have a high Mention Rate with a low Citation Rate. This happens when the model is comfortable recommending a company by name because it’s well known while sourcing its factual claims from an independent review site, a comparison article, or a directory instead of the brand’s own pages.
- Share of Voice can rise even while your Citation Rate stays completely flat, if competitors lose visibility rather than you gaining it. Conversely, your Citation Rate can climb while your Share of Voice holds steady, if competitors are improving at the same pace.
This is sometimes called the citation paradox, and it’s the single most important reason not to report any one of these four numbers in isolation. A dashboard with only a Citation Rate percentage on it is answering one narrow question and implying a broader one.
The Formula
Citation Rate (%) = (Prompts With At Least One Citation to Your Content ÷ Total Tracked Prompts) × 100
For example: testing 200 prompts on ChatGPT, with 52 of those prompts producing a response that cites your site, gives a Citation Rate of (52 ÷ 200) × 100 = 26%.
Now compare that across engines, using the same 200-prompt library on each platform:
| Engine | Tracked Prompts | Prompts Citing You | Citation Rate |
|---|---|---|---|
| ChatGPT | 200 | 52 | 26% |
| Google AI Overviews | 200 | 39 | 19.5% |
| Perplexity | 200 | 71 | 35.5% |
| Gemini | 200 | 44 | 22% |
Averaging across engines before reviewing them individually is one of the more common ways teams flatten real, actionable differences into a meaningless composite score. In the example above, a blended average (~26%) would hide the fact that Perplexity is your strongest channel by a wide margin and Google AI Overviews is your weakest two very different action items that a single number erases.
A note on counting methodology
Before this formula produces a trustworthy number, you need a fixed rule for what counts as “at least one citation,” and you need to apply it the same way every time:
- Does a citation buried at the bottom of a long answer count the same as one that anchors the opening sentence? Most tools don’t distinguish, but you can layer in Answer Position as a supporting metric if this matters to your reporting.
- Because the same prompt can return different answers across repeated runs, a single pass through your prompt library produces a noisy estimate. Running each prompt multiple times (a handful of repetitions per prompt, at minimum) and averaging gives a far more stable number than a single test.
- Decide up front whether a citation to a subdomain, a syndicated republish of your content, or a PDF hosted on your domain all count as “your content” and apply that rule consistently across reporting periods so trend lines stay comparable.
None of these choices needs to be objectively “correct.” They need to be fixed and documented, because the entire value of tracking Citation Rate over time comes from comparing like with like.
Why “What’s a Good Citation Rate” Has No Single Answer
Citation Rate is shaped by four variables at once, and any benchmark that ignores one of them is incomplete:
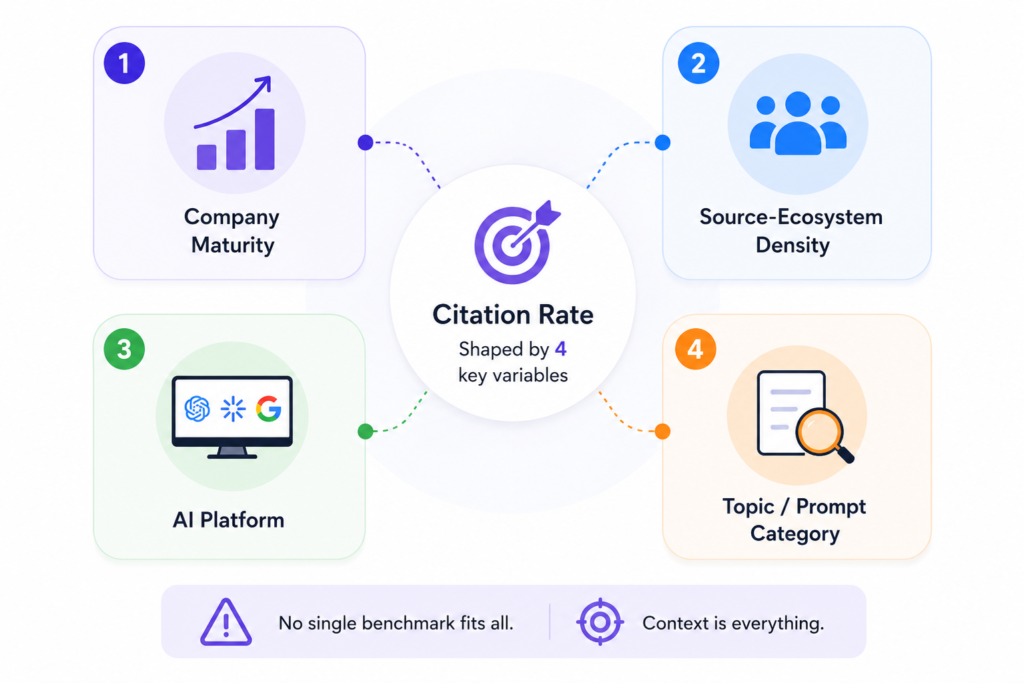
1. Company maturity- Content volume, domain authority, and years of publishing history all expand the surface area a model has to cite. A six-month-old site with excellent individual articles will still lag a decade-old publisher simply because it covers far fewer of the questions in its category this is a coverage gap, not necessarily a quality gap.
2. Source-ecosystem density in your category-Some industries finance, B2B SaaS, travel, healthcare have thousands of competing authoritative publishers, analyst firms, and government resources all vying to be cited on the same questions. Others niche B2B software, regional legal or contracting services, highly specialized manufacturing have only a handful of credible sources in existence. A thin ecosystem doesn’t automatically guarantee a higher rate for your business, though: models may simply default to government, regulatory, or academic sources instead of any commercial site, which can cap commercial citation rates regardless of competition.
3. The AI platform- Each engine has its own retrieval architecture, ranking preferences, and citation interface. Perplexity is built around surfacing multiple visible sources as a core part of its answer experience; ChatGPT’s citation behavior depends heavily on which mode or feature generated the response; Gemini’s citations are shaped by its connection to Google’s underlying search index. A rate measured on one platform is not a like-for-like comparison to the same number on another.
4. The topic or prompt category being tested-Citation Rate is topic-dependent, not just domain-dependent. The same company can have a strong Citation Rate for its core subject and a noticeably weaker one for an adjacent topic where it has published less, has fewer backlinks, or is competing against more established specialists. This is why benchmarking at the domain level alone (“what’s our overall citation rate”) is less useful than benchmarking at the topic-cluster level (“what’s our citation rate specifically for our primary product category, versus adjacent categories where we publish less”).
Because of this four-way interaction, single-number benchmarks “aim for 30% citation rate” are close to meaningless without knowing which of these four variables produced the number being compared against.
A more honest reference grid
Rather than a flat target, it helps to think in terms of a directional range shaped by stage and ecosystem density:
| Stage | Competitive Ecosystems (SaaS, Finance, Travel, Healthcare) |
Thin Ecosystems (Niche B2B, Regulated, Local Services) |
|---|---|---|
| Early-stage | Low single digits as your content library, topical authority, and external trust signals are still developing. | Slightly higher headroom because there are fewer established competitors to displace, although performance remains modest. |
| Growth | Steady improvement as topic clusters expand, backlinks accumulate, and AI systems gain confidence in your content. | Can grow faster from a smaller competitive base, but may eventually be limited by government or regulatory authority sources. |
| Established | Meaningfully higher visibility, though each additional percentage point becomes increasingly difficult against mature publishers. | Can reach substantially higher visibility by becoming the recognized specialist authority within a focused niche. |
| Category Leader | Represents the highest practical visibility band in the industry, with no fixed upper limit. | Also reaches the highest achievable visibility, although the total citation opportunity is smaller because the market itself is narrower. |
For a rough anchor point, practitioner benchmarking in 2026 has generally clustered around a 10-25% Citation Rate as the range associated with healthy AI Overview performance useful as a sanity check on your own number, though, consistent with everything above, not a target to chase blindly without knowing your own baseline, platform mix, and prompt segmentation.
Segment by Prompt Type -This Matters More Than the Overall Number
A single blended Citation Rate hides prompt types that are fundamentally different in difficulty and that answer different business questions:
| Prompt Type | Example | What a Citation Here Actually Proves |
|---|---|---|
| Category | “Best AI visibility tools” | Real competitive discovery your brand was chosen among genuine alternatives. |
| Problem-Solution | “How do I measure AI citations?” | Demonstrates topical authority before the user has selected a specific brand. |
| Commercial | “AI visibility software for agencies” | Shows visibility during the buying and evaluation stage when users are considering solutions. |
| Branded | “[Brand] pricing” | Almost guaranteed visibility because the brand is already explicitly mentioned in the prompt. |
| Comparison | “[Brand] vs. [Competitor]” | Measures positioning within an already-shortlisted set of options rather than new brand discovery. |
Branded and comparison prompts inflate an overall number because the brand is part of the question being asked the model has little choice but to reference it. Blend these into your headline metric and you will systematically overstate real competitive visibility. The fix is to report three figures instead of one:
- Discovery Citation Rate – category and problem-solution prompts only. This is the cleanest read on whether new, undecided customers are finding you.
- Commercial Citation Rate – buying and evaluation-stage prompts.
- Branded Citation Rate – brand-name and comparison prompts, tracked for consistency and message accuracy rather than competitive reach.
A company with a 45% Branded Citation Rate and an 8% Discovery Citation Rate is not actually winning its category it is well-documented to people who already know its name. Segmenting the metric this way is what turns it from a vanity number into something a content team can actually act on.
Setting a Target Instead of Chasing a Benchmark
Start with your own baseline, not an industry average. Establish your current Citation Rate using a fixed prompt library, a fixed platform (or set of platforms measured separately), a fixed competitor set, and a fixed counting rule. If your current rate is, say, 11% across 250 non-branded prompts on ChatGPT, that number measured consistently is worth more to you than any published industry figure, because it’s the only number your future measurements can be honestly compared against.
Set a realistic move over a defined window, not an absolute number. A jump from an arbitrary current rate straight to “30%” ignores your starting point, your industry’s ceiling, and your content maturity. A more useful framing sets an incremental, achievable move over roughly a quarter:
| Current Citation Rate | Realistic Move Over ~90 Days | What Typically Drives It |
|---|---|---|
| Very Low (Single Digits) | A few percentage points of absolute gain. | Publishing foundational topic-cluster content and closing obvious content coverage gaps. |
| Low-to-Moderate | A modest, steady increase. | Expanding topic coverage, strengthening internal linking, and earning quality backlinks. |
| Moderate-to-Strong | Smaller absolute gains that require more effort. | Refreshing existing content, publishing original research, and earning third-party citations and PR mentions. |
| Already Strong | Focus on defending share rather than expecting major growth. | Closing remaining topic gaps, maintaining content freshness, and staying ahead of competitors as they improve. |
What Actually Moves the Number
Progress rarely comes from a single article or a one-time technical fix. It comes from compounding several signals that retrieval systems consistently favor when selecting which sources to cite:
- Expanding topical coverage-The more of the real questions in your category that have a genuinely good answer on your site, the more opportunities exist for a model to retrieve and cite you instead of a competitor. Isolated standout articles help less than a connected cluster of content around a subject.
- Publishing original research or proprietary data-Information that can’t be found or replicated elsewhere gives a model a specific reason to point to you rather than paraphrase a widely available fact from a dozen other sources. This isn’t just intuitive it’s the pattern that shows up most consistently in 2026 sourcing studies: original data and proprietary research are repeatedly identified as the single highest-leverage content type for earning citations across ChatGPT, Perplexity, and Google AI Overviews alike, generally outperforming top-of-funnel “what is” or “how to” content.
- Earning third-party mentions and coverage-Guest content, analyst reports, credible independent reviews, and conference or podcast appearances all feed the broader source ecosystem a model draws from and models frequently cite coverage of you even in cases where your own site never surfaces directly.
- The scale of this effect is larger than most teams assume: one 2026 industry analysis of AI citation sourcing found that the large majority of citations over 80% by one estimate trace back to earned, non-paid media rather than a brand’s owned pages or paid placements, reinforcing that PR and third-party coverage function as a citation channel in their own right, not just a brand-awareness exercise.
- Keeping existing content current- Retrieval systems tend to favor freshness, particularly on fast-moving topics where outdated information carries real risk of being wrong. This preference for freshness is measurable, not just a best practice: one large-scale citation analysis covering roughly 17 million citations found that AI-cited content ran about 25.7% fresher, on average, than typical organic search content a meaningful gap that suggests a content-refresh cadence carries real citation-rate weight on its own, independent of topic coverage or link authority.
- Strengthening internal linking and topic clustering- This helps a retrieval system understand the depth and relationships behind your content, rather than treating each page as an isolated, disconnected asset.
- Monitoring continuously rather than optimizing once- Because platforms update their retrieval systems and competitors publish new content constantly, a citation rate that looked strong six months ago can quietly erode without an ongoing measurement process to catch it.
Building a Lightweight Validation Process
Automated AI-visibility tools are useful for scale, but no tool perfectly captures every nuance of how a citation is rendered across every platform. A brief, periodic manual check keeps automated numbers honest:
- Pull a representative sample of your tracked prompts a few dozen is usually enough to spot systematic issues.
- Run those prompts manually, directly on each platform, rather than relying solely on the tool’s automated pass.
- Compare what you see against what the tool reported citation presence, citation position, and any brand mentions without a citation.
- Investigate any meaningful discrepancy rather than assuming the automated number is correct by default.
- Keep a short log of platform changes or methodology adjustments over time, since a sudden shift in your reported rate is often explained by a retrieval-system update rather than anything you did.
Where These Ranges Come From and Their Real Limits
There is no public reporting standard for AI citation data comparable to what exists for traditional search nothing equivalent to Search Console with verified, platform-disclosed numbers. Most commercial AI-visibility vendors don’t publish their raw datasets, prompt libraries, or cohort methodology, so any benchmark including the reference grid above should be read as a directional estimate drawn from repeated prompt testing and general retrieval-system behavior, not a statistically representative industry average.
Before trusting any published citation-rate benchmark, check whether it discloses:
- Prompt count, and whether prompts were repeated across multiple runs to account for response variability
- Which platform or platforms were tested
- Whether branded and comparison prompts were separated out or blended into the headline number
- Industry and geographic scope
- How a “citation” was defined and counted
A study built on a couple dozen branded prompts in one narrow category is not comparable to one built on several hundred non-branded prompts spanning multiple industries and most benchmarks that appear to contradict each other are actually just measuring different things, not disagreeing about the same underlying reality.
Your own number can look artificially low if you’re deliberately testing broad, non-branded, genuinely difficult prompts in a crowded field that’s usually a sign of rigorous measurement, not weak performance. It can look artificially high if branded and comparison prompts dominate the set, if only one platform was tested, or if the sample size is small enough that a handful of prompts swing the percentage significantly. Read Citation Rate next to Mention Rate, Share of Voice, and downstream AI-driven traffic never in isolation.
Frequently Asked Questions
1. Is Citation Rate comparable across AI engines?
No, measure and report each platform separately, then track trends within each one individually.
2. How often should I revisit my benchmark and targets?
A practical cadence is: check for major anomalies weekly if you’re actively working on a visibility initiative, compare against your baseline monthly, and do a fuller review quarterly that includes refreshing the prompt library and reassessing whether your targets still make sense. Treat every number in this space as a living reference point tied to a specific methodology, not a fixed, permanent grade.
3. What’s the single biggest mistake teams make when starting out?
Comparing their own number to an industry average pulled from an unrelated report different platform, different prompt mix, different industry instead of establishing their own baseline first. The industry number might be directionally useful for setting expectations, but it should never replace a measurement built on your own consistent methodology.
Want to know where your brand stands in the citation economy?
We run a free 6-platform AI visibility audit during a 30-minute strategy call. No prep required — we'll scan your category live during the conversation.